Don’t invest unless you’re prepared to lose all the money you invest. This is a high-risk investment and you should not expect to be protected if something goes wrong. Take two minutes to learn more.

This article is not intended to be financial, investment or trading advice. This article is for information and solely for education purposes. It does not protect against any financial loss, risk or fraud.
Following in the spirit of my last article, it’s worth looking in more depth at bitcoin and its relationship with the Standard & Poor (S&P) 500 Index.
The index is made up of the 500 largest US companies and is often used as a tracker for the whole of the US stock market and the health of the US economy.
The most common narrative pushed by cryptocurrency insiders is that bitcoin price movements don’t correlate with the S&P 500. Below we shall look into whether this holds true when compared to equity markets.
Let’s start at the beginning – 2009. Bitcoin emerges from the ashes of the great financial collapse and begins its first 12 years surrounded by record economic growth; the United States experiencing its longest bull run in history. At its pinnacle, multiple trillion-dollar companies now exist.
Bitcoin rides this wave of monetary optimism and posts gains unheard of, even in these booming times. From a zoomed-out perspective, both bitcoin and the S&P 500 have rocketed up at the same time; the two bull markets in sync, but as we know nothing in finance moves in a straight line.
Let’s zoom in. Below is a graph from Digital Assets Data, a cryptocurrency data company.
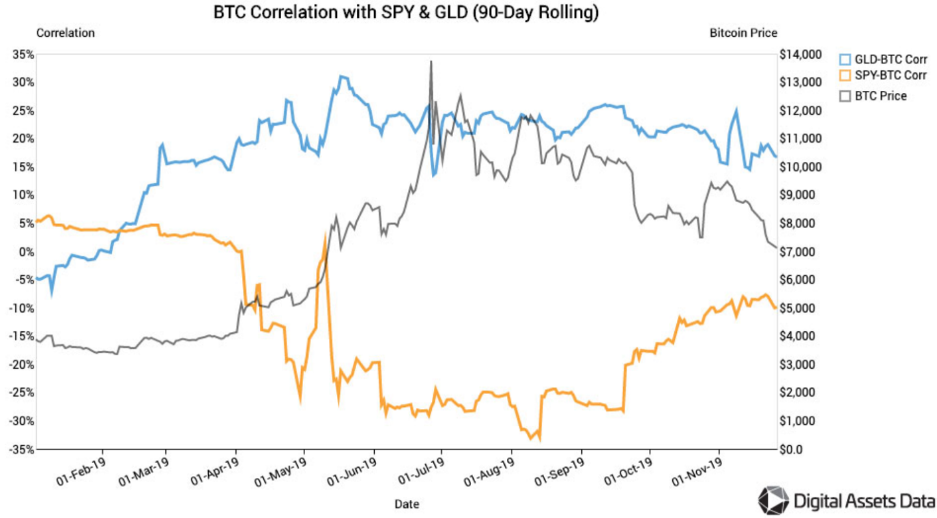
It looks at the percentage correlation between the S&P 500 (SPY) and bitcoin over time. Plus the correlation for gold.
The graph shows that in this period of time bitcoin generally showed negative correlation to the stock market, whilst gaining correlation with gold, perhaps due to growing fears of economic instability - pre-coronavirus if you can remember then!
However, bitcoin famously plummeted along with the S&P 500 in early March, bringing the cries of correlation to the forefront of the crypto community.
Often forgotten is that something similar happened in the week following bitcoin’s historic high in 2018. As bitcoin tumbled from close to $20,000 the S&P 500 was also dropping, crashing over 10% that week.
During both of these times, the correlation between the two assets ran at all time highs. In these scenarios, was bitcoin moving with the S&P, or was it facing a sell off as a risk asset in times of extreme market volatility?
On the flip side, there have been many times where bitcoin has posted serious gains whilst the stock market has remained flat or dropped. Take May 2019, where bitcoin posted gains of over 60% whilst the S&P 500 dropped more than 6%.
What’s more, despite the unprecedented market instability in 2020, so far BTC is only down 8% from the start of the year, compared to the S&P 500’s 22%.
Looking over an extended period of time the data shows that bitcoin is usually uncorrelated to the S&P 500. But it’s important to note that this can drastically change in periods of extreme price movements in equities markets.
Currently that means bitcoin cannot be seen as a short-term hedge against collapses in the equity markets.
Correlation will be an important metric to follow as the market matures and more institutional money enters the space. Ultimately these new entrants will be the most likely to decide how bitcoin’s price reacts to global events in the future.
The above is not investment advice.
 |
Written by Max Worontschak, resident crypto expert at Skrill |
Cryptocurrencies are complex products with high price volatility. They are unregulated, without consumer or financial protections. Only risk what you can afford to lose.
For more information, please go to the Skrill Cryptocurrency Risk Statement and the Skrill Cryptocurrency Terms of Use.

Related articles