Don’t invest unless you’re prepared to lose all the money you invest. This is a high-risk investment and you should not expect to be protected if something goes wrong. Take two minutes to learn more.

This article is not intended to be financial, investment or trading advice. This article is for information and solely for education purposes. It does not protect against any financial loss, risk or fraud.
What is inflation?
Inflation can be defined as a rise in prices over time. These price rises lead to a decline in your purchasing power (how much you can buy with your money).
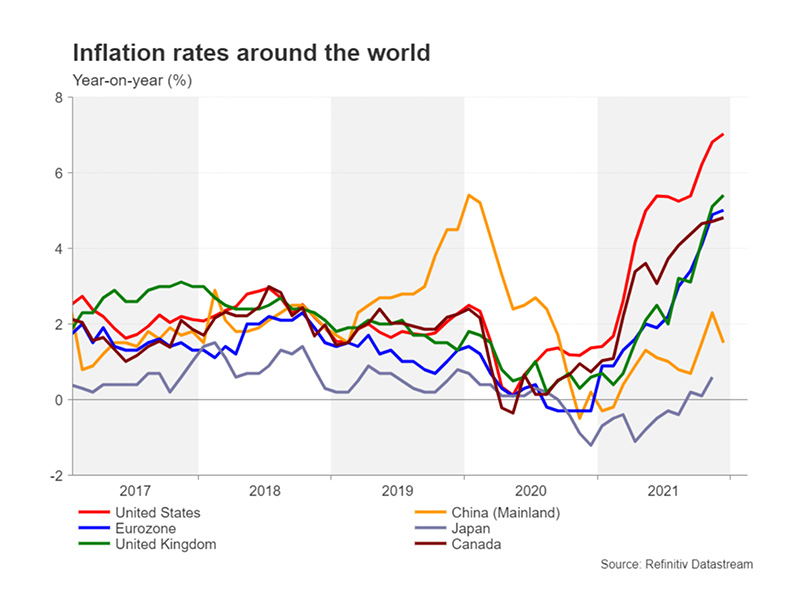
When measuring inflation, central banks use indexes such as the Consumer Price Index (CPI) and the Producer Price Index (PPI). As shown in the graph, price inflation has been surging around the world.
Monetary inflation is a sustained increase in the money supply of a country (or currency area).
Consumer price increases are often confused with monetary inflation. Central banks have little direct control over the former but can influence the latter.
The types of money supply
The different types of money supply are known as M1, M2 and M3.
M1 is ‘narrow money’ and includes coins and notes in circulation, currency, and demand deposits. M2 and M3 are ‘broad money’ and include M1 plus savings and some money market funds (but not as liquid as M1).
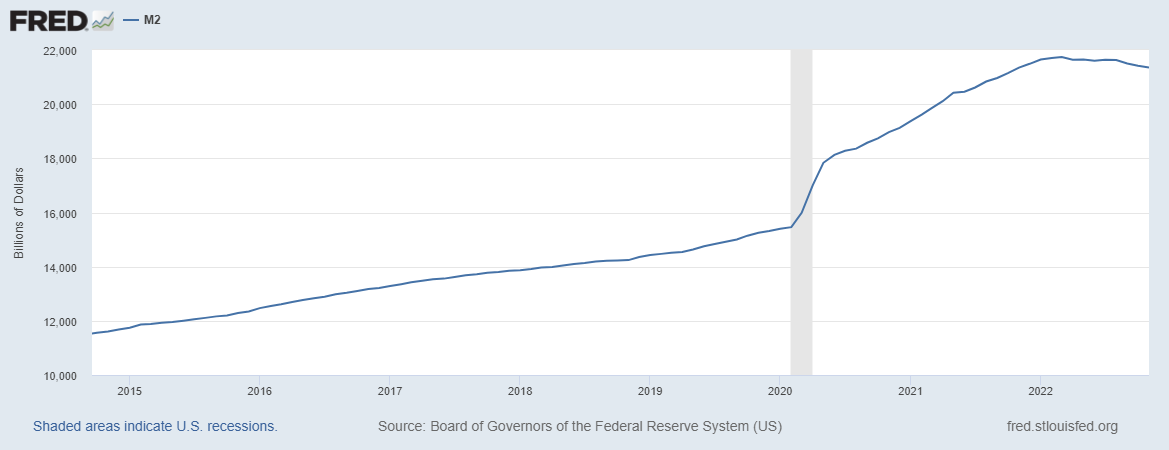
Typically, M2 is the best estimation of overall money supply growth, and it has been significant in recent years. The supply growth of other major currencies follows a similar trend.
Crypto inflation
Once we understand the two types of inflation in the traditional monetary system, we can look at crypto inflation.
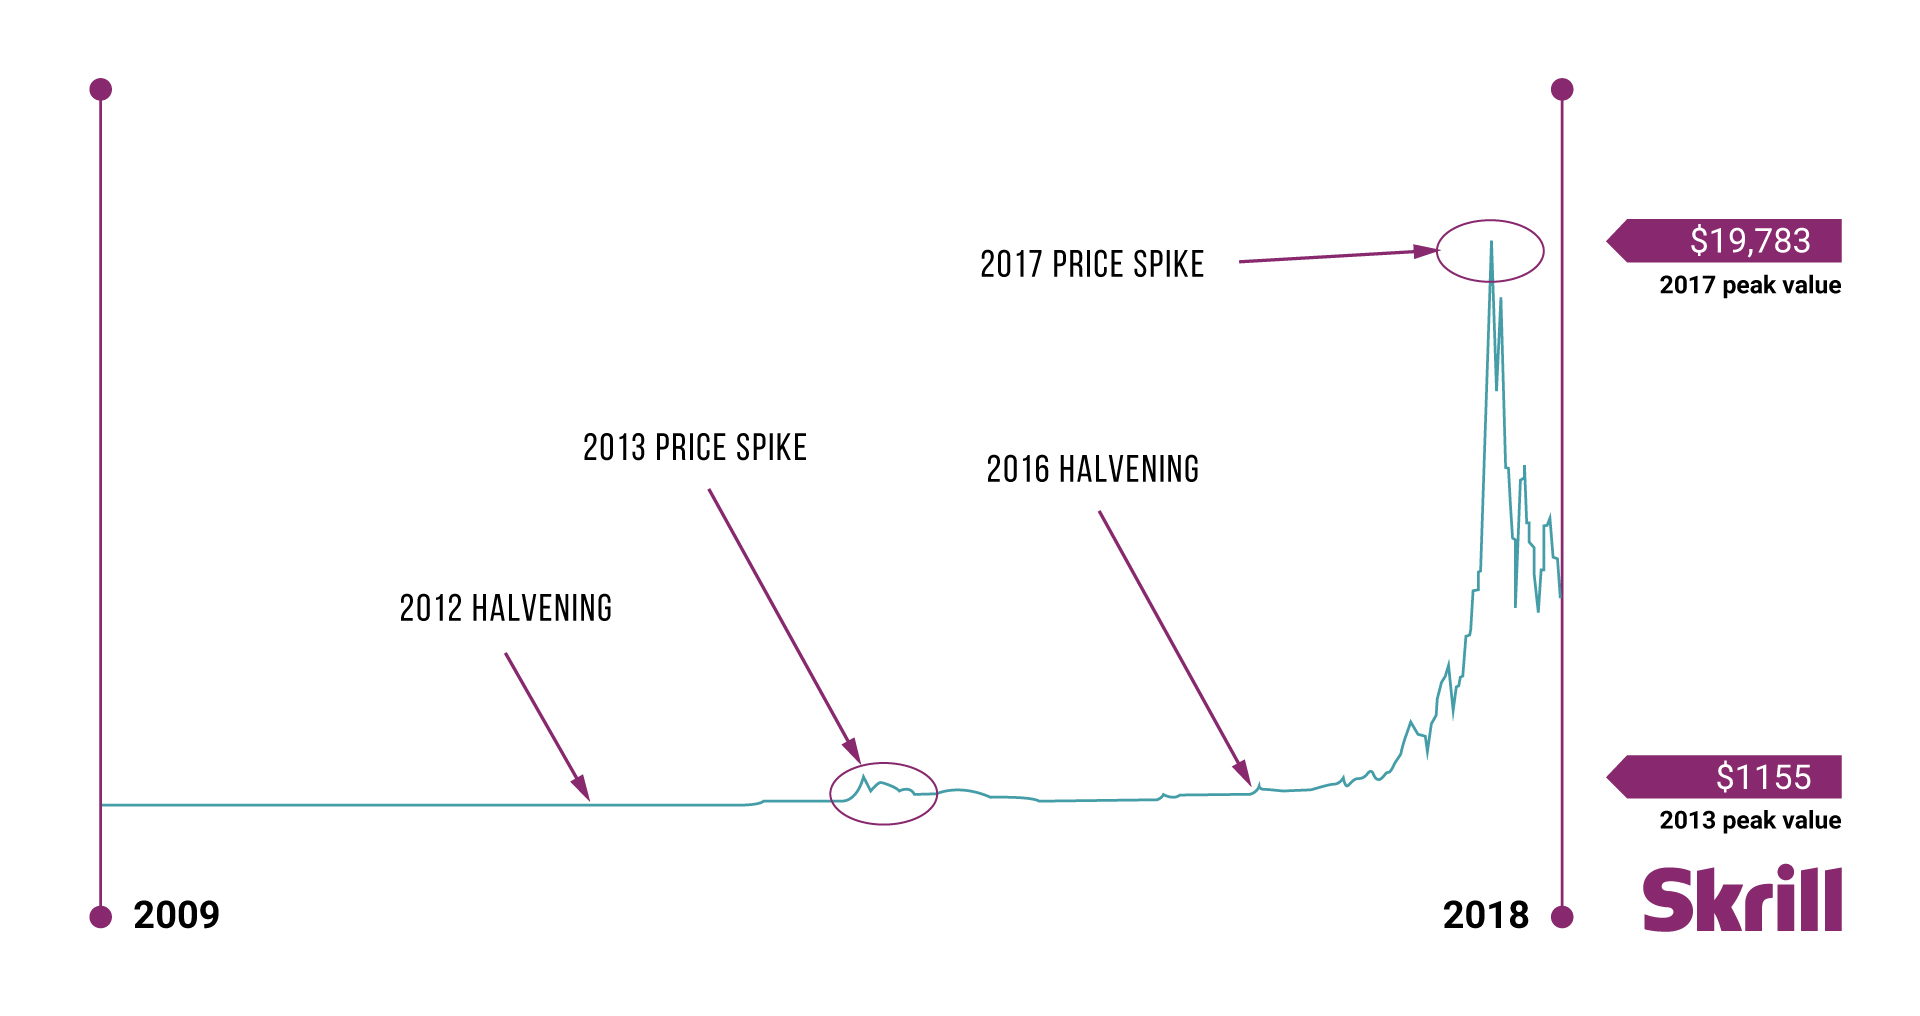
In the digital asset world, inflation relates to new coins being introduced to circulating supply, typically by miners and validators. Considering that Bitcoin has a projected fixed supply of 21 million units, with new supply halving roughly every 4 years, the current inflation rate is about 1.8%. The next Bitcoin halving event is expected in May 2024.
In the case of Ethereum, the inflation rate is variable depending on network usage and miner rewards, which have changed since the Merge. Pre-merge, Ethereum was inflating at about 4.6%, but post merge many are expecting it to drop below 0.5% per year and turn negative if network activity increases further.
To summarize, the inflation rate for both Bitcoin and Ethereum is already very low and in future there will be even lower supply growth.
The digital asset space is a small and volatile fragment of the economy (about €1 trillion total market cap at the time of writing). Minor changes in the supply of cryptocurrencies are not likely to have as great an impact as a significant change in the consumer price index (CPI), monetary inflation, and policy.
Some believe that Bitcoin halving cycles drive crypto price cycles, but given the space is now more institutionalized, correlations to the macro landscape are much more likely.
Crypto and the consumer price index (CPI)
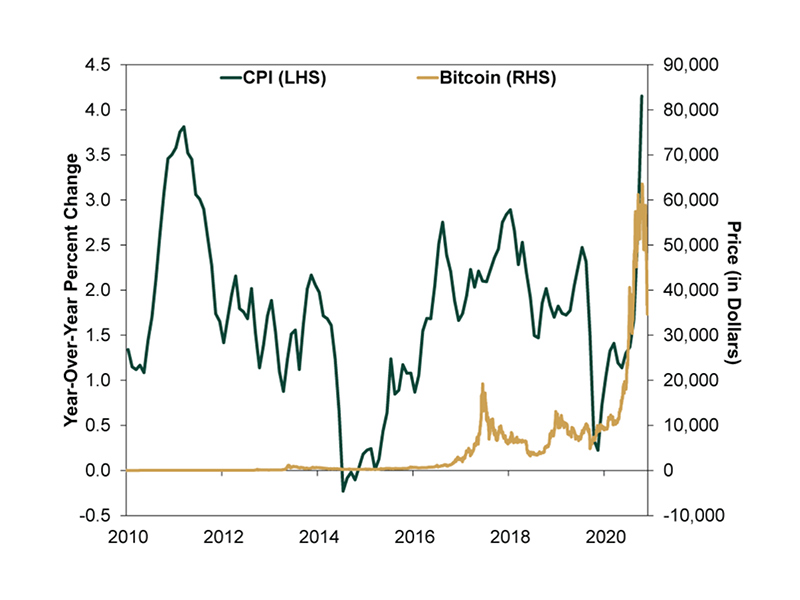
Some question Bitcoin’s store of value and its potential to act as a hedge against inflation when looking at the CPI.
But the graph shows that if there is any correlation between the CPI rising and Bitcoin’s price, it is negative. If consumer prices increase, Bitcoin’s price usually falls. The same holds for the entire digital asset space.
When people are faced with price increases on the items they need the most, there’s less disposable income available to them.
Given necessities like buying food and paying your energy bills tend to rank higher in priority than Bitcoin and other cryptocurrencies, it’s normal for people to reduce spend on cryptocurrencies and their exposure overall to digital assets.
Crypto and monetary inflation
Monetary inflation, i.e., a growth in money supply, typically leads to an increased CPI.
But monetary inflation doesn’t measure the prices that consumers and producers pay. Instead, it’s a measure of the amount of money in circulation.
When the M2 supply grows, Bitcoin and crypto usually experience large gains. When it shrinks, crypto often struggles.
If you go back to the first graph in this article, you can see that M2 started topping out at the end of 2021 and the beginning of 2022. This aligns with the top in the crypto market last year. It could be a coincidence, but the chart below suggests that’s not the case.
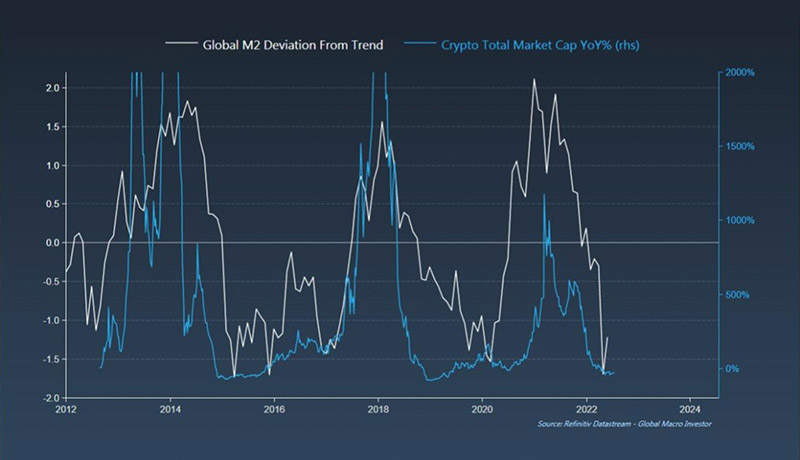
Historically, the total crypto market cap has grown when M2 supply has grown and vice versa. In other words, crypto is a monetary inflation hedge and when the money supply starts to expand again, we can expect the crypto market cap to follow suit.
Try crypto with Skrill today
- Buy and sell over 40 different cryptocurrencies, now including Polkadot
- Set conditional orders to control your trading
- Earn points and be rewarded with Skrill's loyalty programme, Knect
Cryptocurrencies are unregulated in the UK. Capital Gains Tax or other taxes may apply. The value of investments is variable and can go down as well as up.

Related articles