
Price action is the raw price data of a market — without indicators. The ‘analysis’ part is learning to read these and make a trade based upon patterns.
Indicators are the mathematical formulae that traders use on their charts to decide when to make trades. And, without them, it can be difficult to act on the insights the data provides.
But indicators aren’t without limitations. They can be delayed, based on past data and don’t always tell the whole story.
Price action analysis is a simpler and sometimes more accurate way to make the right decision.
By combining this guide to Forex price action analysis with forex trading tools, you’ll have a good grasp of trends and how to manage your money.

Core characteristics of price action analysis
Here are the basic things you need to know:
- Price action refers to the up and down movement of an asset/item’s price when it’s plotted over time.
- Often you’ll see charts with averages plotted on, but raw price charts have the ‘candlesticks’.
- Many traders use candlestick charts for trading decisions, since they help better visualise price movements by displaying the open, high, low, and close values in the context of up or down sessions.
- Many short-term traders rely exclusively on price action and the formations and trends learned from it to make trading decisions.
- Technical analysis is all based on price action. This means you’re not looking at the raw data when using technical analysis because it uses past prices to inform trading decisions.
- Price action trading is more of an art than a science: two traders may arrive at different conclusions when analysing the same price action.
One trader may see a downtrend, while another might believe that the price action shows the possibility of a turnaround — purely based on their personal experience reading the charts.
Price action strategies in practice
For the most part, you use price action analysis for short- or medium-term trades rather than long term. Usually it’s for smaller profit gains too.
First steps
You must first take a look at the movement of the price action — identify whether it’s in a bullish or bearish trend — and make a decision on whether you think it’s likely to turn.
The terms bullish and bearish refer to a positive or negative market movement. They are inversions of each other: bullish is an upwards trend and bearish a downwards trend.
Common Bulls and Bears
Below we cover a few common trends to help you analyse the data.
Price action charts can seem complex. If you’re not sure how to read candlestick charts, check out our guide to reading forex charts.
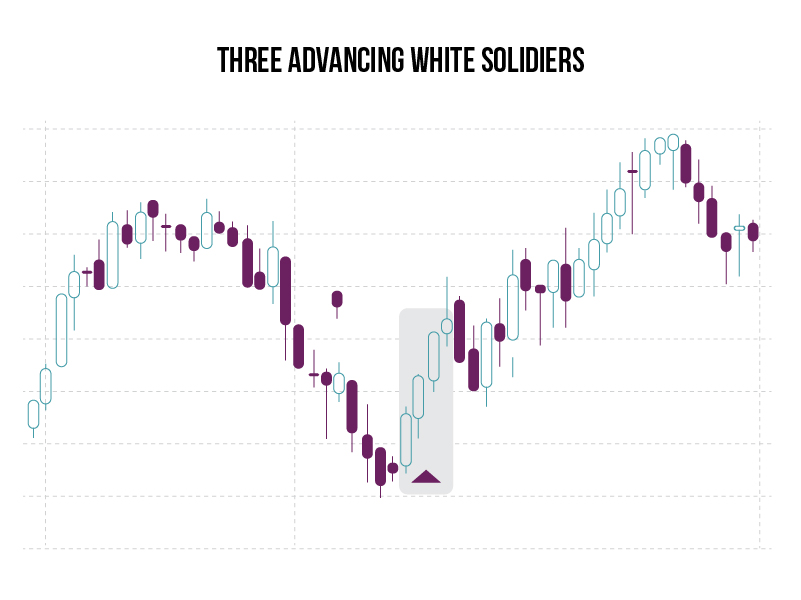
Three White Soldiers
What is it?
A bullish candlestick pattern you can use to predict the reversal of the current downtrend in a pricing chart.
The pattern consists of three consecutive long-bodied candlesticks that open within the previous candle's real body and a close that exceeds the previous candle's high.
What does it signify?
The three white soldiers suggests a strong change in market sentiment in terms of the stock, commodity or pair making up the price action on the chart.
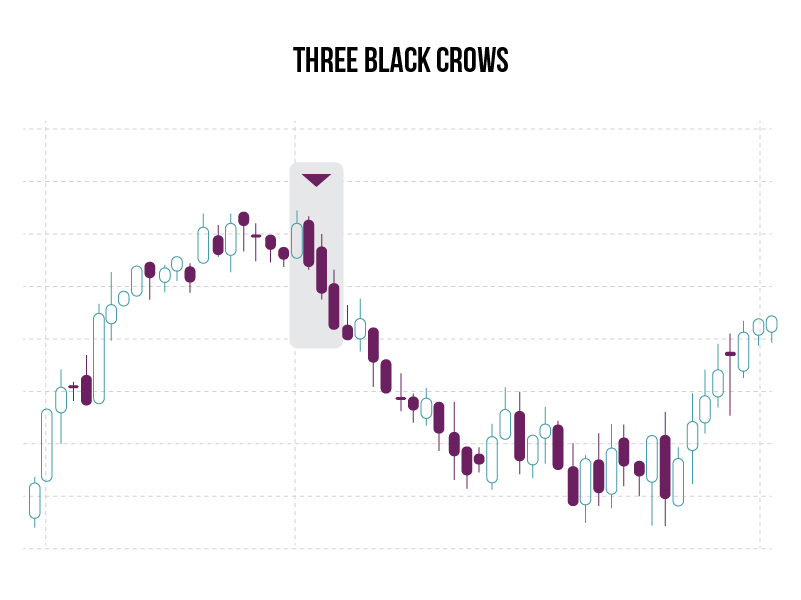
Three Black Crows
What is it?
The black crow pattern consists of three consecutive long-bodied candlesticks that have opened within the real body of the previous candle and closed lower than the previous candle.
What does it signify?
Three black crows is a bearish candlestick pattern that can predict the reversal of an uptrend.
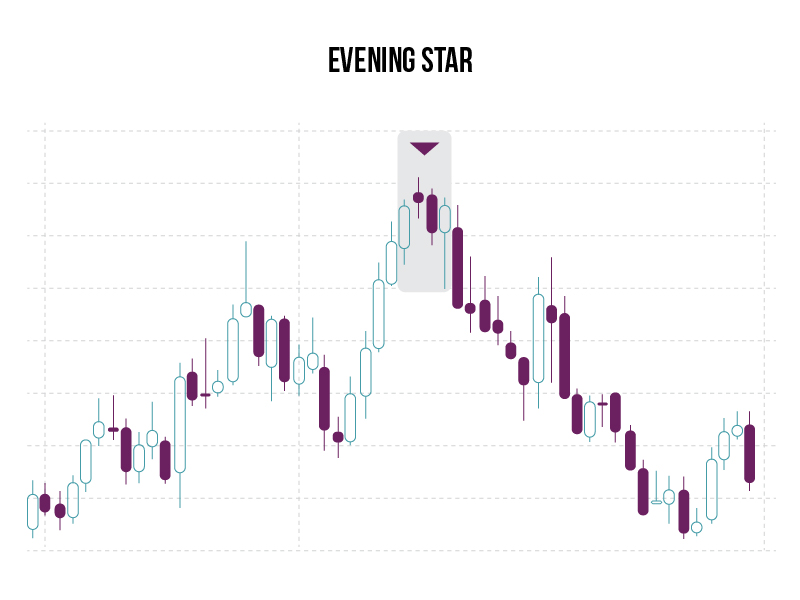
Evening Star
What is it?
An evening star is a bearish candlestick pattern consisting of three candles: a large white candlestick, a small-bodied candle, and a red candle.
What does it signify?
This pattern is used by traders as an early indication that an uptrend may be about to reverse.
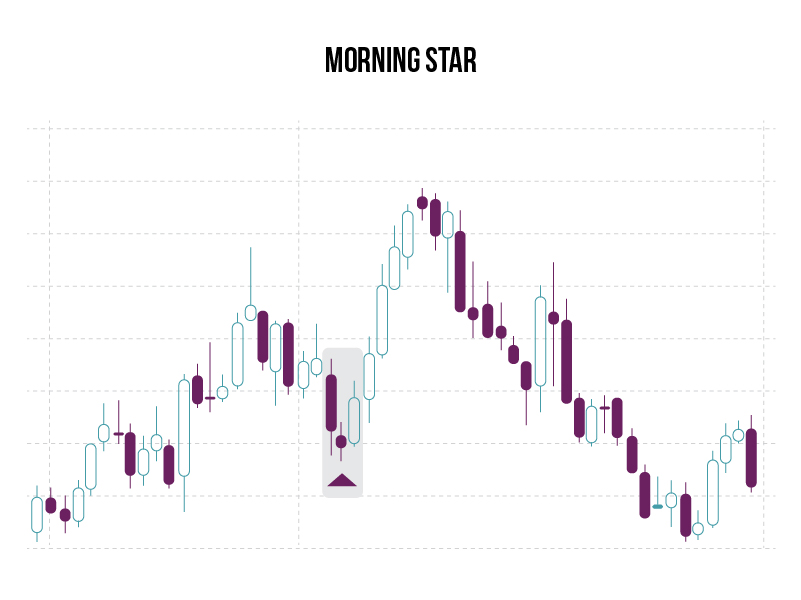
Morning Star
What is it?
A morning star is a visual pattern consisting of three candlesticks, and forms after a downtrend.
What does it signify?
It could indicate the start of an upward climb.
When it comes to learning to trade experience is key. Give it a go, learn to read the patterns and trends in forex charts and develop your own theories.
Related articles