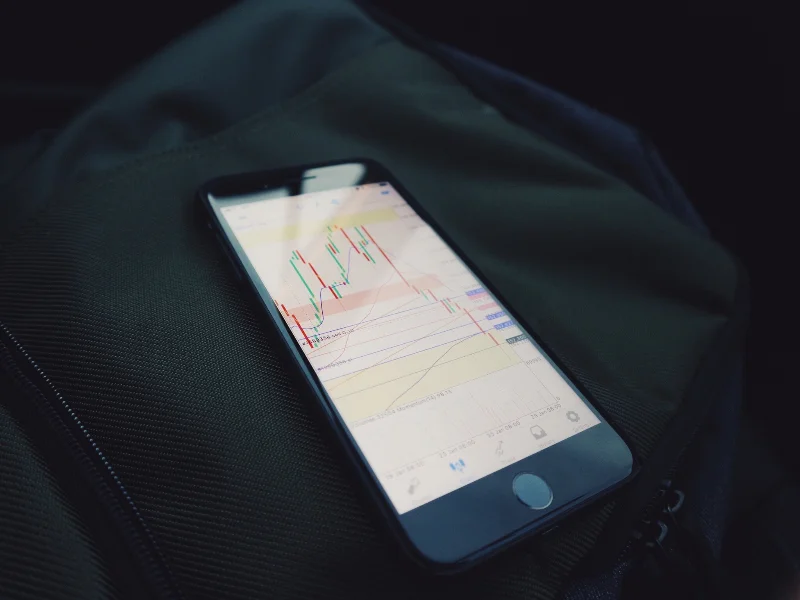
When it comes to forex trading, timing is everything.
As a trader you’ll spend much of your time deciding on the right time to either enter or exit the market. To make these decisions, you will rely on forex signal indicators – in short, signs that tell you it’s time to either buy or sell.
In trading, technical analysis is the study of past and present prices in order to determine future market behaviour. Indicators play an important role in this analysis.

Technical indicators are analysis tools used to support price chart analysis. Most forex trading platforms come with a default set of the most popular technical indicators.
Each indicator is a useful tool in helping a trader understand something about how price action is changing – and put it into context.
Why are indicators so useful?
Technical indicators are useful to traders for a number of reasons.
On one hand, they help to simplify complex market movements by generating clear buy and sell signals. They also help traders gain an understanding of what other traders are thinking and feeling through indicators such as momentum trackers.
When used correctly, indicators help traders make disciplined and informed decisions.
Types of market indicators
In general, forex indicators fall into one of three categories.
- Leading Forex indicators
- Lagging Forex indicators
- Confirming Forex indicators
Leading indicators
As their name implies, leading indicators give early warnings regarding where the price is likely going to move in future. These indicators are used to determine the direction to trade before the new trend has started.
It’s important to be wary when it comes to leading indicators because these indicators can give you false signals. In other words, they often lead traders in the wrong direction.
Examples of leading indicators are relative strength indexes (RSIs) and stochastic indicators. Let’s consider RSIs.
Relative strength indicators (RSIs)
An RSI is used most often to help traders identify market momentum, market conditions and warning signals for adverse price movements.
The RSI is expressed as a figure between 0 and 100. An asset with an RSI of around 70 is often considered overbought, while an asset at or near 30 can be thought of as oversold.

An overbought signal suggests that short-term gains could be coming to an end and that a price correction may come soon. In contrast, an oversold signal could mean that short-term losses may soon come to an end and that assets will soon strengthen.
Yet, as mentioned, traders should be careful of relying on leading indicators, as markets won’t always behave as they suggest.
Lagging forex indicators
Lagging indicators are considered “following” indicators and are delayed relative to current market price.
The general idea behind lagging indicators is that they remove a lot of market noise, making trends clearer. However, the downside to lagging indicators is that they only alert you to a new trend after that trend has started.
Moving Average Crossover
The classic moving average crossover system is a good example of how lagging indicators signal a shift in market sentiment after a new trend has started. With moving averages, “convergence” means that two moving averages are coming together, while “divergence” means that they’re moving away from each other.
If moving averages are converging, it suggests market momentum is decreasing. If the moving averages are diverging, momentum is likely increasing.
Confirming forex indicators
Lastly, we come to confirming technical indicators. As their name implies, confirming indicators are used to confirm that your readings of price action are correct. One of the most popular confirming indicators is known as “On Balance Volume” or OBV.

On Balance Volume (OBV)
On-balance volume is a technical indicator of momentum, which uses volume changes to make price predictions. OBV shows the crowd sentiment that can predict a bullish or bearish market outcome.
One way to interpret OBV readings is that it gives you a sense of other traders’ aggressiveness; the volume should increase when the market moves in both an uptrend or in a downtrend. If an uptrend is lacking momentum as shown by an OBV indicator, it's unlikely to be sustained.
Transact at trading platforms with Skrill
Whatever indicators you plan on using in your trades, you’ll need an easy way to deposit and withdraw from forex brokers.
A Skrill wallet lets you keep all your trading funds in one place and move the money between platforms when it suits you. So instead of relying on your bank, you can simply use your Skrill credentials.
How to use signal indicators
With so many indicators out there, you should take the time to get familiar with as many as you can, starting with a few and then adding more as time goes on.
No one indicator will give you the right answer, which is why most traders use multiple. Insight, discipline and taking a closer look at the market will help you succeed as a trader over the long term.


