Perhaps you’re starting out on your forex trading career, or maybe you want to expand on your techniques. Whatever your reason for looking into forex strategies, we’ve got a rundown of the most popular.
Getting started
If you’re a complete beginner in forex trading, don’t worry – we all were once. We’ve created a complete beginner’s guide to forex trading to help you get to grips with common forex terms.
Even if you consider yourself an expert, it’s always useful to learn new approaches. Here, we look at the most popular strategies, what makes them work and signs to watch out for.
The strategies
Below are the most popular forex trading strategies. They’re designed to help traders minimise risk while trying to make a profit, but the usual warnings apply: no investment strategy is guaranteed to yield profits.
Long-short strategy
Skill level: beginner
You choose a large collection of forex pairs and rank them in order of their alpha factor (how well they are performing compared to a benchmark figure).
You go long (buy the currency) on the top ranking pairs, short (bet on the currency dropping in value) on the bottom ones, and ignore those in the middle.
Day trading
Skill level: beginner – pro
A more hands-on approach, day trading involves using forex charts to gauge the performance of selected forex pairs.
Buy and sell throughout the day as you identify fluctuating signals – buy when you think the currency will rise in value; sell if you think it’ll drop. Monitoring is constant, meaning second-by-second trading.
We say this is beginner to pro level because you’ll find your optimum trading frequency and improve your hit rate as you grow in experience.
Swing trading
Skill level: intermediate
Swing traders profit from short-term price patterns.
They monitor their favoured forex pairs and look for signals that they will change in value, buying the currencies that look undervalued and selling them when they go back up.
Swing traders can become highly skilled at spotting signals, but it’s a technique that takes time to learn.
Scalping
Skill level: intermediate – pro
Another real-time strategy, scalping is the constant buying and selling of currencies as they rise and fall to make money on each transaction.
The focus is on making lots of small profits before exiting the trade rather than predicting long-term trends. Read our full guide on scalping here.
Positional trading
Skill level: intermediate – pro
A more long-term strategy, positional trading involves studying forex pairs and buying currencies when research indicates that they will strengthen over time.
In positional trading you’ll ignore minor drops in favour of the longer goal, although you’ll usually set a stop loss (an instruction to automatically sell if the value falls below a certain level) just in case.
Pairs trading
Skill level: pro
Pairs trading uses the theory that a given forex pair will always revert to its mean position. So a collection of similar pairs are selected and ranked by how far from the mean they are.
But unlike the long-short strategy, you’ll short the top ranking pairs and long the bottom ones.
Trading tools and charts
Learning to read and understand forex charts is vital to the success of any trade. We’ll summarise the main ones below.
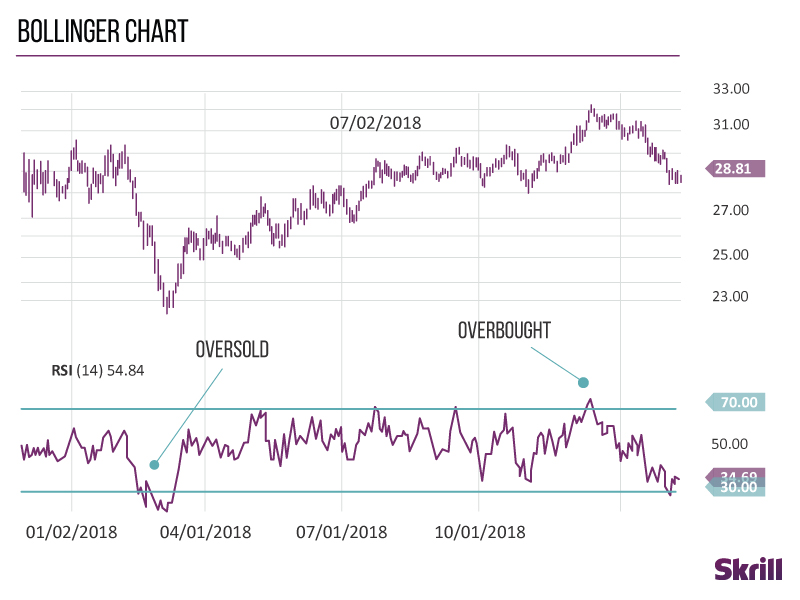
Bollinger bands
A simple line graph of a forex pair shows their performance over time, but that’s it. Traders need to know the volatility of the pair, and that’s where Bollinger bands come in.
The chart shows three lines; the actual trading value in the middle, and the upper and lower averages above and below it. You use these to identify overbought and oversold currencies.
Fibonacci bands
A forex Fibonacci strategy applies a mathematical sequence theory to movements.
When certain thresholds of upward or downward movement are reached, the theory predicts that the trend will continue, helping you decide whether to enter a long or short position.
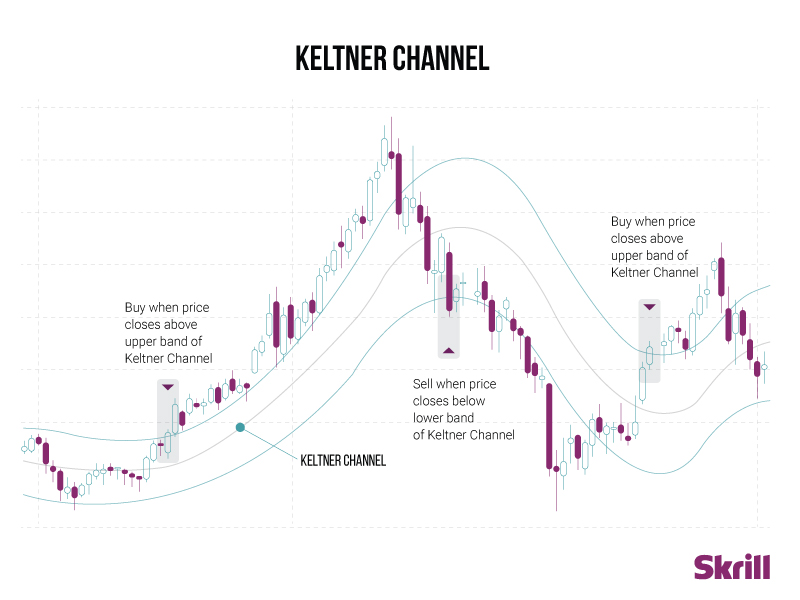
Keltner bands
A Keltner channel shows volatility over time. It plots three lines:
- The middle line is an exponential moving average (EMA) of the price. Additional lines are placed above and below the EMA.
- The upper band is typically two times the Average True Range (ATR) above the EMA.
- The lower band is typically set two times the ATR below the EMA.
Momentum indicators
Momentum is the speed of change in a forex pair. Momentum indicators determine the strength and weakness in one side of a forex pair and make it easier to decide whether to go long or short.
Choosing the strategy that's right for you
If you’re asking yourself “can I trade forex for a living?” you need to understand the strategies and measurement methods described.
Whether you’re entering a low-risk forex arbitrage strategy or trying out advanced forex trading strategies, these tools will be your friends for life. And remember, your Skrill account should be your go-to when moving money quickly across forex platforms.
Related articles